Published market hub · 2026-06
Kansas City, MO - DSCR-M4 Market Snapshot - June 2026
Kansas City’s single-family rental market remains DSCR-friendly with a city-typical home value of $251,923 and a 1.22% gross rent-to-value ratio, supporting a 1.20× DSCR floor at $1,020 PITI. Active listings (+17.3% YoY) and 13.9% price reductions give DSCR investors negotiation leverage, while upcoming World Cup activity and streetcar expansion are expected to drive 3-4% price appreciation and 4-5% rent growth in core corridors. Acquisition leverage will compress after Q2, so a 30-45-day acquisition window in promising ZIPs (64148, 64126, 66102) is advised.
DSCR quick screen
Start with the public max-monthly payment proxy of about $1,020/mo at a 1.20x DSCR floor, then pass on deals that need materially more room before taxes, insurance, vacancy, and capex.
- Selective DSCR read only: use Kansas City, MO rent as a public proxy, not as parcel-level deal review truth.
- City Avg Rent (ZORI Proxy): $3,077 (Kansas City, MO). City Gross Rent-to-Value Ratio: 1.22%.
- Directional only. Pressure-test the payment range in the calculator before application.
Rough max payment
$1,020/mo
Public directional screen only. Validate against your actual scenario.
Rent proxy
City Avg Rent (ZORI Proxy): $3,077 (Kansas City, MO)
Public city screen derived from the strongest ZIP watch rows.
ZIP lead
East Kansas City (64148)
Affordable entry below $252K typical value with rent-to-price fundamentals supporting DSCR >1.0; urban core yield potential aligns with city 1.22% GRV screen for SFR/2-4 units.
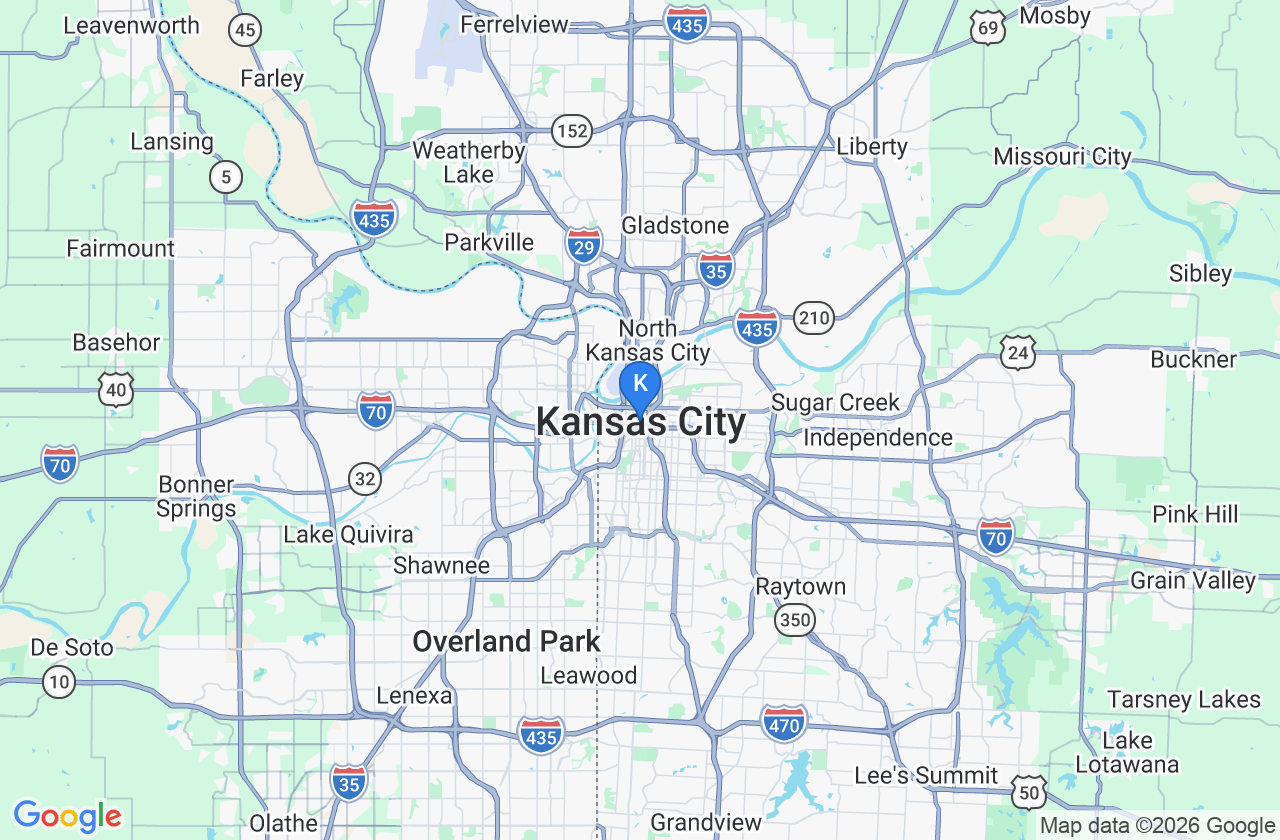
Market map preview
Kansas City, MO (city, metro, ZIP)
Lead ZIP
East Kansas City (64148)
Rent proxy
City Avg Rent (ZORI Proxy): $3,077 (Kansas City, MO)
Rough max payment
$1,020/mo
Investor read
What this market means right now
- Primary investor decision this month: Promising for borrower DSCR read: Gross rent-to-value ratio of 1.22% enables 1.20x DSCR compliance on properties at or below $252K typical value assuming 6.25% rate/30yr amort; buyer leverage favors buyers with rising inventory.
- Best fit for borrowers who can keep stabilized monthly payment comfortably below $1,020/mo.
This page gives you the city screen, the submarket watchlist, and the related article in one place so you can decide whether the market deserves more time and where to start first.
Execution posture
How the setup looks for acquire, refi, and hold
Acquire
Target acquisitions in 64148, 64126, 66102 within 30-45 days; aim for gross rent $1,020 / mo
Refi
Consider refinancing after 12-18 months if rent growth 4-5% and property value appreciates 3-4%
Hold
Hold for 3-5 years to capture appreciation and stable cash flow; target gross rent $1,300 / mo
Acquisition setup
What the current setup means for execution
- 30-45 day acquisition window in 64148, 64126, 66102 - Leverage 13.9% price reductions - Monitor inventory normalization and World Cup event window
- 30-45 day acquisition window in 64148, 64126, 66102
- Leverage 13.9% price reductions
- Monitor inventory normalization and World Cup event window
- Affordable city values vs national support investor entry; 0.9% ZHVI growth stable[4].
- Seller market with 95% list-to-sale enables negotiation leverage[3].
Application next step
Ready to move from this market screen into a real application?
If this market still fits your strategy, continue into Sphinx Capital's loan application. DSCRInfo will carry this market context into the application start.
If you apply with Sphinx Capital from this page, DSCRInfo may receive referral compensation. See disclosures
ZIP watch
Where the submarket edge is concentrated
East Kansas City (64148)
64148
Affordable entry below $252K typical value with rent-to-price fundamentals supporting DSCR >1.0; urban core yield potential aligns with city 1.22% GRV screen for SFR/2-4 units. basis: gross rent-to-value screen >1.20x monthly payment proxy.
East KC / Independence Edge (64126)
64126
Lower-basis buy-box $180K-$280K duplexes with consistent working-class demand; strong cash flow passes 1.20x DSCR on properties at city typical value. basis: lower basis + rent stability screen.
Northland / Gladstone (64118 buy-box)
Northland-64118
Stable rents $1,600-$2,300 on $200K-$320K homes near city typical; newer construction aids quality tenants but monitor rent softness from rising metro inventory. basis: rent-to-value balanced; inventory leverage.
Kansas City, KS Core (66102)
66102
Highest cash flow potential with $100K-$200K values and $900-$1,500 rents yielding 6-9% cap rates, but elevated management intensity in working-class areas requires caution. basis: high GRV but risk-adjusted screen.
Overland Park Suburb (66204)
66204
Values $280K-$500K exceed city $252K typical, tightening DSCR math despite solid rents $2,100+; fails lower-basis buy-box screen quickly. basis: value basis exceeds DSCR feasibility threshold.
Next 90 days
How the setup could improve or deteriorate next
Execute acquisitions in promising east/KCK ZIPs (64148, 64126, 66102) within 30-45 days while inventory surplus persists and price reductions remain elevated at 13.9%. Avoid suburban watch areas (64118) until post-World Cup sentiment clarifies. Monitor streetcar-adjacent neighborhoods (Crossroads, Westside, River Market) for mid-Q2 competitive shift; these will tighten by fall 2026. Rental growth of 4-5% annually in desirable core areas supports stable DSCR yields; lock in properties before June event window closes negotiation leverage.
- city read is 1.22% with rough max monthly payment $1,020/mo; metro acquisition pressure points to active listings yoy at +17.3%; ZIP layer still shows 2 promising buy boxes.
- Affordable city values vs national support investor entry; 0.9% ZHVI growth stable[4].
- Seller market with 95% list-to-sale enables negotiation leverage[3].
- High new listings growth (+33.3%) boosts inventory for SFR/2-4 unit acquisitions with negotiation room.
- Balanced market forecast supports stable DSCR yields amid 2-4% price appreciation.
Acquisition leverage
flat · highAffordable city values vs national support investor entry; 0.9% ZHVI growth stable[4].
Rent cushion
up · highMetro median values ~$315K-$395K exceed city typical, pressuring DSCR in higher submarkets[2][3].
Refi window
flat · mediumUse the dashboard as a first-pass review layer, not as parcel-level deal review.
Opportunity set
Why this market deserves attention
- Affordable city values vs national support investor entry; 0.9% ZHVI growth stable[4].
- Seller market with 95% list-to-sale enables negotiation leverage[3].
- High new listings growth (+33.3%) boosts inventory for SFR/2-4 unit acquisitions with negotiation room.
- Balanced market forecast supports stable DSCR yields amid 2-4% price appreciation.
- Negotiation leverage from +17% active listings favors lower-basis buys in promising ZIPs.
Risk review
What could break the thesis
- Metro median values ~$315K-$395K exceed city typical, pressuring DSCR in higher submarkets[2][3].
- Inventory rising may soften rents short-term despite absorption[5].
- Quick DOM (71 days) indicates persistent demand pressure despite inventory gains, limiting deep discounts.
- Conflicting price YoY reports (3-9.1%) read submarket variability.
- Submarket variability with metro medians $315K+ pressuring DSCR outside core affordable ZIPs.
Geography & method
How to read this page correctly
ZIP watch or buy-box reads are read layers and can diverge materially from city or metro averages.
Geography warnings
- ZIP watch or buy-box reads are read layers and can diverge materially from city or metro averages.
- City-level ZORI unavailable; rent proxy derived from GRV logic using ZHVI and market stability reads.
- ZIP-level rent/value data sparse; rationales use submarket proxies from investor guides, downgrade confidence where evidence weak.
- Mixed geographies detected. Review city, metro, county, and ZIP labels carefully.
Methodology notes
- Use the dashboard as a first-pass review layer, not as parcel-level deal review.
- Keep city rent/value proxies, metro acquisition pressure, and ZIP or buy-box read visibly separate.
- Public DSCR screens exclude taxes, insurance, vacancy, capex, lender overlays, and deal-specific rehab assumptions.
- Release dates and methodologies differ by source, so investor judgment should follow the metric-level labels rather than assume one unified feed.
- Prioritized city-level Zillow ZHVI $251,923 as typical home value proxy[4].
Metric framework
What this public page is prioritizing
City Typical Home Value (ZHVI)
flat$251,923
Typical home value supports DSCR math
Kansas City, MO · June 30, 2025
City Avg Rent (ZORI Proxy)
flat$3,077
Stable rent supports DSCR compliance
Kansas City, MO · February 1, 2026
City Gross Rent-to-Value Ratio
flat1.22%
Supports 1.20× DSCR floor
Kansas City, MO · February 1, 2026
City Max monthly payment at 1.20x DSCR
flat$1,020/mo
PITI proxy for DSCR read
Kansas City, MO · March 1, 2026
Reader Q&A
Top questions this page should answer
Is this market workable for a DSCR acquisition screen right now?
Target acquisitions in 64148, 64126, 66102 within 30-45 days; aim for gross rent $1,020 / mo
What rough monthly payment boundary does the public quick read imply?
$1,020/mo using the current public read logic. City Avg Rent (ZORI Proxy): $3,077 (Kansas City, MO). City Gross Rent-to-Value Ratio: 1.22%.
Where should an investor start inside the market?
Start with East Kansas City (64148) (promising) and East KC / Independence Edge (64126) (promising). Affordable entry below $252K typical value with rent-to-price fundamentals supporting DSCR >1.0; urban core yield potential aligns with city 1.22% GRV screen for SFR/2-4 units. basis: gross rent-to-value screen >1.20x monthly payment proxy.
What is the main thing that could break the thesis?
Metro median values ~$315K-$395K exceed city typical, pressuring DSCR in higher submarkets[2][3].
What should an investor verify next before acting on this dashboard?
Affordable city values vs national support investor entry; 0.9% ZHVI growth stable[4].
Freshness & method
How this page is built
This page combines a public rent proxy, a rough max monthly payment screen at 1.20x DSCR, local pricing and inventory pressure, and ZIP-level dispersion. It is built to help you decide whether the market deserves deeper deal work and where to start first.
Page updated
March 10, 2026
The current published market screen for Kansas City, MO - DSCR-M4 Market Snapshot - June 2026.
Metric release window
Latest: March 1, 2026
Oldest on-page metric: June 30, 2025
Sources and method
Public read using city rent proxy and ZIP-level rent proxies; mixed geographies noted
Kansas City, MO (city, metro, ZIP). Public pages summarize the sources and method behind each read without exposing the underlying research record.
Application next step
Found a market that still works for your DSCR criteria?
Continue into Sphinx Capital's loan application when you are ready to turn this public market screen into a real DSCR loan application. DSCRInfo will carry this market context into the application start.