Published market hub · 2026-05
Cleveland, OH: start in ZIP 44105 before you widen the search
Meets 1.20× DSCR threshold. Rent growth YoY is +4.9% indicating strengthening cash flow. Start in ZIP 44105, where the current setup looks strongest today. Before deeper deal work, check insurance, taxes, and fee load on the actual property.
DSCR quick screen
Use about $1,183/mo as the public first-pass monthly payment ceiling at a 1.20x DSCR read, then pass on deals that need materially more room before taxes, insurance, vacancy, and capex.
- Meets 1.20× DSCR threshold
- City rent proxy: $1,419/mo.
- Directional only. Pressure-test the payment range in the calculator before application.
Rough max payment
$1,183/mo
Public directional screen only. Validate against your actual scenario.
Rent proxy
City rent proxy: $1,419/mo
Public city screen derived from the strongest ZIP watch rows.
ZIP lead
ZIP 44105
gross rent to value
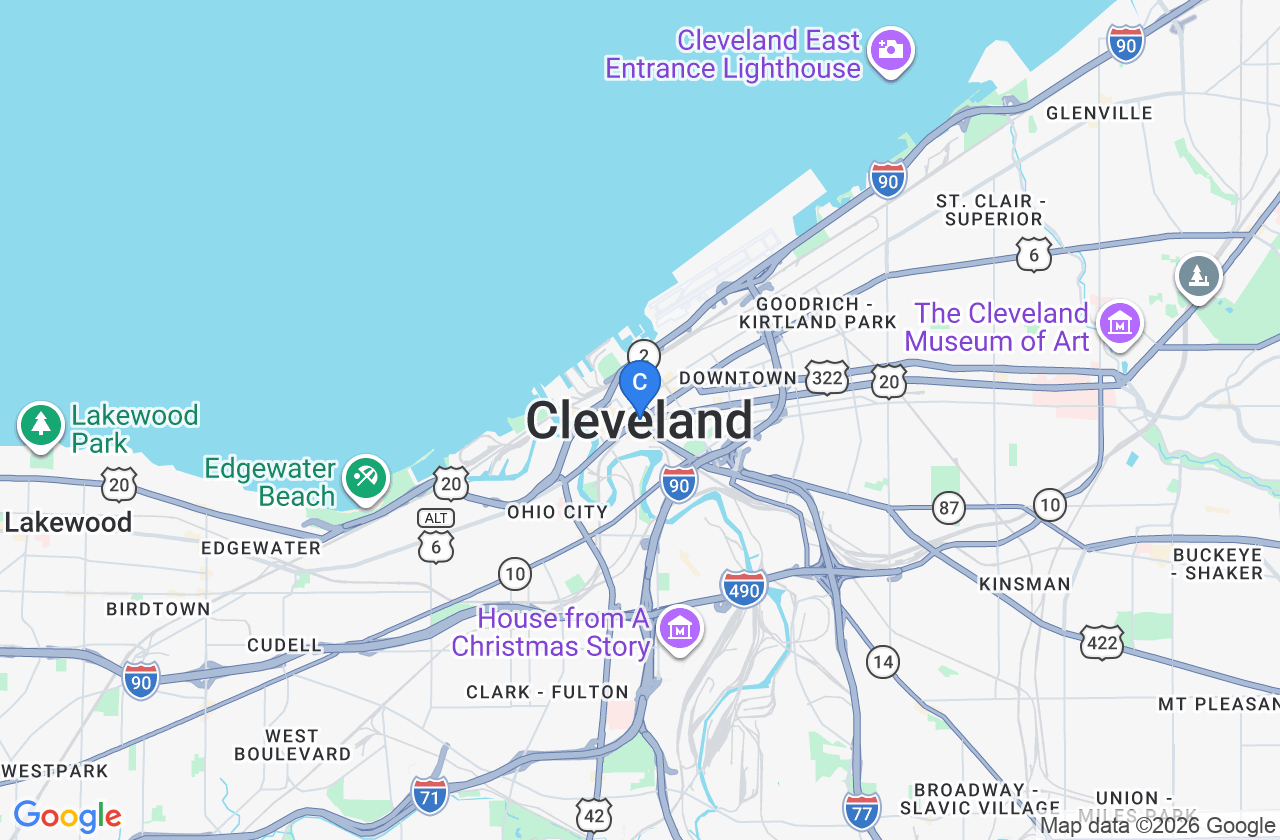
Market map preview
Cleveland, OH dashboard with city, metro, and ZIP evidence labeled separately.
Lead ZIP
ZIP 44105
Rent proxy
City rent proxy: $1,419/mo
Rough max payment
$1,183/mo
Investor read
What this market means right now
- Investors can comfortably meet a 1.20× DSCR threshold in Cleveland; the rent-to-value dynamics support attractive financing terms and suggest refinancing upside given modest price declines and strong rent growth.
- Best fit when stabilized monthly payment can stay comfortably below $14,190 annual (≈$1,182 mo).
This page gives you the city screen, the submarket watchlist, and the related article in one place so you can decide whether the market deserves more time and where to start first.
Execution posture
How the setup looks for acquire, refi, and hold
Acquire
Target ZIP 44105 and 44108 for acquisition; prioritize properties near University Circle and Tremont with rent-to-value >15%.
Refi
Refinance existing assets now to lock in rates while rent growth stays positive; aim for monthly payment ≤$1,182/mo.
Hold
Hold positions in promising ZIPs and watch price-drop activity in higher-value areas.
Acquisition setup
What the current setup means for execution
Rent growth YoY is +4.9% indicating strengthening cash flow
- Rent growth YoY is +4.9% indicating strengthening cash flow
- Months of supply is 0.99, implying limited inventory and potential price appreciation
- Stable inventory (months of supply ≈ 1.0) gives flexibility to negotiate favorable purchase terms.
- YoY rent growth of +4.9% (Steadily) supports potential rent-increase upside in lower-priced ZIPs.
- Months of supply at 0.99 suggests a tight market, which can help sustain rent growth and property appreciation.
Application next step
Ready to move from this market screen into a real application?
If this market still fits your strategy, continue into Sphinx Capital's loan application. DSCRInfo will carry this market context into the application start.
If you apply with Sphinx Capital from this page, DSCRInfo may receive referral compensation. See disclosures
ZIP watch
Where the submarket edge is concentrated
ZIP 44105
44105
gross rent to value
ZIP 44108
44108
gross rent to value
ZIP 44102
44102
gross rent to value
ZIP 44113
44113
gross rent to value
ZIP 44115
44115
Higher home value ($160,816) but a respectable 13.3% rent-to-value ratio; the ZIP may meet DSCR if price concessions or rent-increase expectations materialize. basis: gross rent to value.
Next 90 days
How the setup could improve or deteriorate next
Investors should prioritize properties in high-demand submarkets (University Circle, Tremont) where seasonal rent spikes are likely, while monitoring rate movements that could affect cash-flow coverage. Maintaining a DSCR cushion of 1.25-1.30 is advisable given potential rate-driven cost increases.
- city read is 12.6% with rough max monthly payment $14,190 annual (≈$1,182 mo); metro acquisition pressure points to active listings yoy at ~0% (stable); ZIP layer still shows 2 promising ZIP pockets.
- Rent growth YoY is +4.9% indicating strengthening cash flow
- Months of supply is 0.99, implying limited inventory and potential price appreciation
- Stable inventory (months of supply ≈ 1.0) gives flexibility to negotiate favorable purchase terms.
- YoY rent growth of +4.9% (Steadily) supports potential rent-increase upside in lower-priced ZIPs.
Acquisition leverage
flat · highRent growth YoY is +4.9% indicating strengthening cash flow
Rent cushion
flat · highLow negotiation leverage - sale-to-list ratio is 99.06% indicating sellers price near asking
Refi window
flat · mediumUse the dashboard as a first-pass read, not as a property-level decision.
Opportunity set
Why this market deserves attention
- Rent growth YoY is +4.9% indicating strengthening cash flow
- Months of supply is 0.99, implying limited inventory and potential price appreciation
- Stable inventory (months of supply ≈ 1.0) gives flexibility to negotiate favorable purchase terms.
- YoY rent growth of +4.9% (Steadily) supports potential rent-increase upside in lower-priced ZIPs.
- Months of supply at 0.99 suggests a tight market, which can help sustain rent growth and property appreciation.
Risk review
What could break the thesis
- Low negotiation leverage - sale-to-list ratio is 99.06% indicating sellers price near asking
- Home-price YoY change is -2.25%, suggesting modest downward pressure
- High price-drop rate (53.85%) may indicate downward price pressure, limiting upside on resale or refinance.
- High price-drop rate city-wide (53.85%) may read downward pressure on home values, affecting refinancing upside.
- Sale-to-list ratio of 99.06% indicates limited negotiation leverage, especially in higher-value ZIPs such as 44113 and 44114.
Geography & method
How to read this page correctly
City and metro metrics are not interchangeable; read them as different geographies with different update cadences.
Geography warnings
- City and metro metrics are not interchangeable; read them as different geographies with different update cadences.
- ZIP watch rows can diverge materially from city or metro averages.
- City metrics are not interchangeable with metro metrics; keep city, metro, and ZIP reads visibly separate.
- ZIP watch can diverge materially from city averages on both basis and rent.
Methodology notes
- Use the dashboard as a first-pass read, not as a property-level decision.
- Keep city rent/value proxies, metro acquisition pressure, and literal ZIP evidence visibly separate.
- Public DSCR estimates exclude taxes, insurance, vacancy, capex, lender overlays, and deal-specific rehab assumptions.
- Release dates and methodologies differ by source, so investor judgment should follow the metric-level labels rather than assume one unified feed.
- City-level median sale price taken from Houzeo; city-level median rent taken from Steadily; rent annualized (×12) for ratio calculations; max monthly payment derived by dividing annual rent by the DSCR target of 1.20 (no interest-rate assumption applied)
Metric framework
What this public page is prioritizing
Typical Home Value (Zillow)
mixed$134,900
Median sale price for Cleveland homes is $134,900
Cleveland, OH · May 1, 2026
Average Rent (Zillow)
mixed$1,419/mo
Concrete city rent basis used for DSCR public read (Average Rent (Zillow)).
Cleveland, OH · May 1, 2026
City Gross Rent-to-Value Ratio
mixed1.05%
Derived from Average Rent (Zillow) and city home value for public first-pass only.
Cleveland, OH · May 1, 2026
City Max monthly payment at 1.20x DSCR
mixed$1,183/mo
Derived from Average Rent (Zillow) at a 1.20x DSCR read floor for public first-pass only.
Cleveland, OH · May 1, 2026
Reader Q&A
Top questions this page should answer
Is this market workable for a DSCR acquisition investor right now?
Selective yes: treat this as a ZIP-by-ZIP acquisition market, not a blanket citywide buy call; start with ZIP 44105 and only pursue deals that still clear conservative DSCR math.
What rough monthly payment boundary does the public quick read imply?
$1,183/mo using the current dashboard math. Average Rent (Zillow): $1,419/mo (Cleveland, OH). Gross Rent-to-Value Ratio: 1.05%.
Where should an investor start inside the market?
Start with ZIP 44105 (promising) and ZIP 44108 (promising). Low median home value ($77,282) and a high gross rent-to-value ratio (17.8%) comfortably exceed the 12% DSCR read, providing strong cash-flow cushion for 1.20× DSCR financing. basis: gross rent to value.
What is the main thing that could break the thesis?
Low negotiation leverage - sale-to-list ratio is 99.06% indicating sellers price near asking
What should an investor verify next before acting on this dashboard?
Rent growth YoY is +4.9% indicating strengthening cash flow
Freshness & method
How this page is built
This page combines a public rent proxy, a rough max monthly payment screen at 1.20x DSCR, local pricing and inventory pressure, and ZIP-level dispersion. It is built to help you decide whether the market deserves deeper deal work and where to start first.
Page updated
June 2, 2026
The current published market screen for Cleveland, OH: start in ZIP 44105 before you widen the search.
Metric release window
Latest: May 25, 2026
Oldest on-page metric: May 1, 2026
Sources and method
This dashboard keeps city rent support, rough max monthly payment, local pricing pressure, and ZIP-level dispersion separate so you can decide whether the market is worth pursuing before deeper deal review.
Cleveland, OH dashboard with city, metro, and ZIP evidence labeled separately.. Public pages summarize the sources and method behind each read without exposing the underlying research record.
Application next step
Found a market that still works for your DSCR criteria?
Continue into Sphinx Capital's loan application when you are ready to turn this public market screen into a real DSCR loan application. DSCRInfo will carry this market context into the application start.